
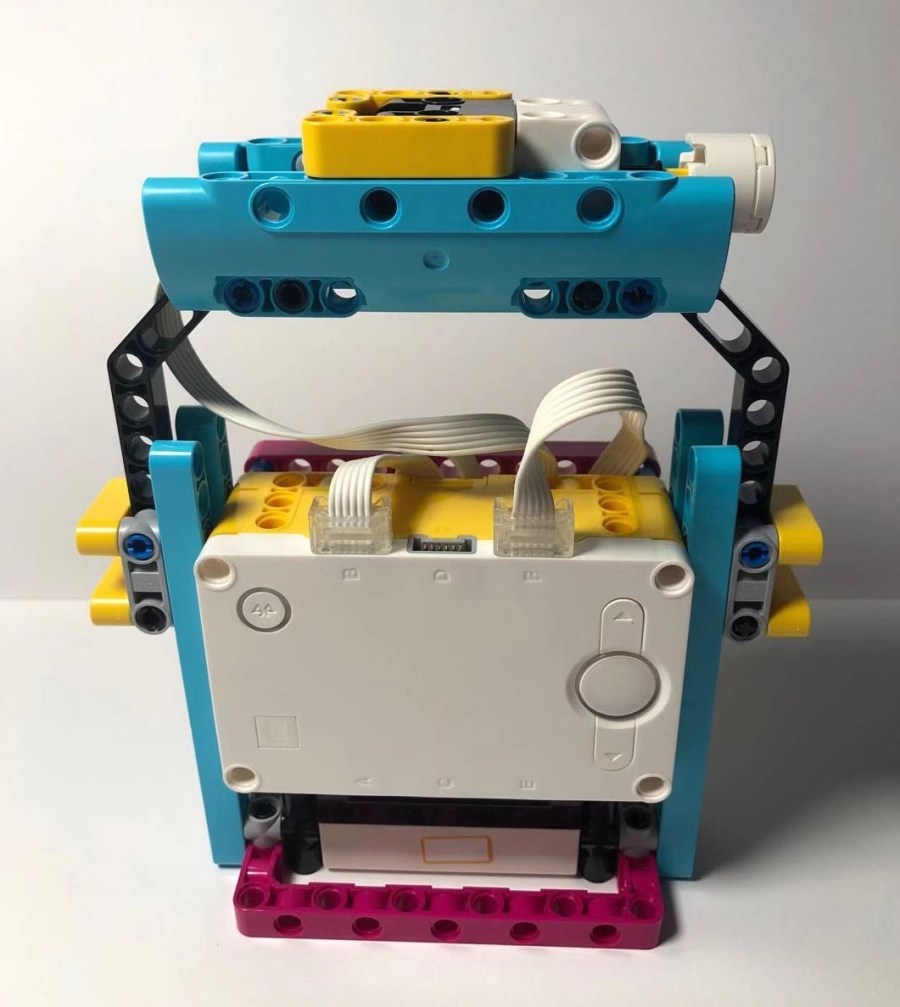
In the App of LEGO Spike Prime, there is an advanced unit category which creates different devices, logs and analyzes gyroscope or accelerometer data. In today’s post, I will use the same model of “Build a Smart Kettlebell” project and introduce how to read and analyze the recorded accelerometer data. I will also update the initial code to enhance its functionality. So let’s start right now!
Understand Accelerometer’s Raw Data
In LEGO Spike Prime, its smart hub embeds a motion sensor, which combines a three-axis accelerometer and a three-axis gyroscope. An acceleration sensor measures the acceleration applied to the device. Please note the existence of gravity might confuse you when reading the vertical acceleration value of accelerometer. The row data contains the acceleration of gravity: 9.81 m/ s2. Therefore, to measure the real acceleration of the device, the contribution of the force of gravity must be removed from the accelerometer raw data.
vertical acceleration raw data = real acceleration of the device + 9.81 m/ s2
More useful information about motion sensor and accelerometer, please refer to this page: https://developer.android.com/guide/topics/sensors/sensors_motion.
For example, when the smart hub is sitting on a table (and not accelerating), the accelerometer’s real acceleration is 0, and plus 9.81 m/ s2, it reads a magnitude of 9.81 m/s2. Similarly, when the device is in free fall and therefore its real acceleration is – 9.81 m/s2, its raw data shows a magnitude of 0 m/s2. If you carry the smart hub to jump up with a real acceleration of A m/s2, the acceleration value is equal to A + 9.81.
Understand Sensor Orientation
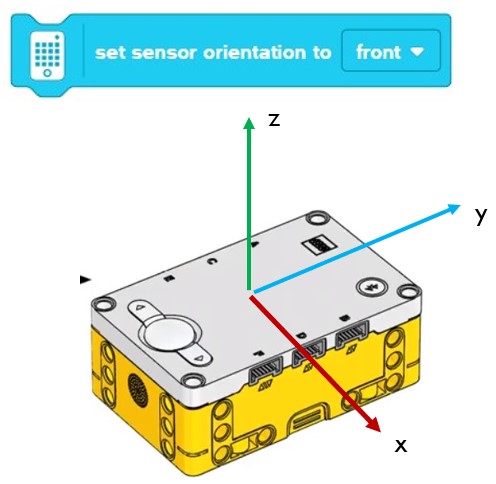
Setting sensor orientation to different values will affect the direction of x, y and z axes. For example, if we use the default sensor orientation of “front”, positive direction of x, y and z axes are shown in the above image.
If we keep sensor orientation of “front”, but turn smart hub so that its right side is facing up, its x, y and z axes will not swap automatically, as shown below. That means, the positive direction of x axis is now facing upward. When we carry the device and jump up and down, the recorded x, y and z acceleration value also indicates that positive direction of x axis points upward.
You might notice that the values of y and z acceleration are not zero. It is due to our natural sway of body when we change posture. When we hold this kettlebell, it not only moves up and down with our jumping action, but also sways left and right, front or back. Therefore, you could see the value change on both y and z directions, but compared to z direction, their magnitude is much smaller.
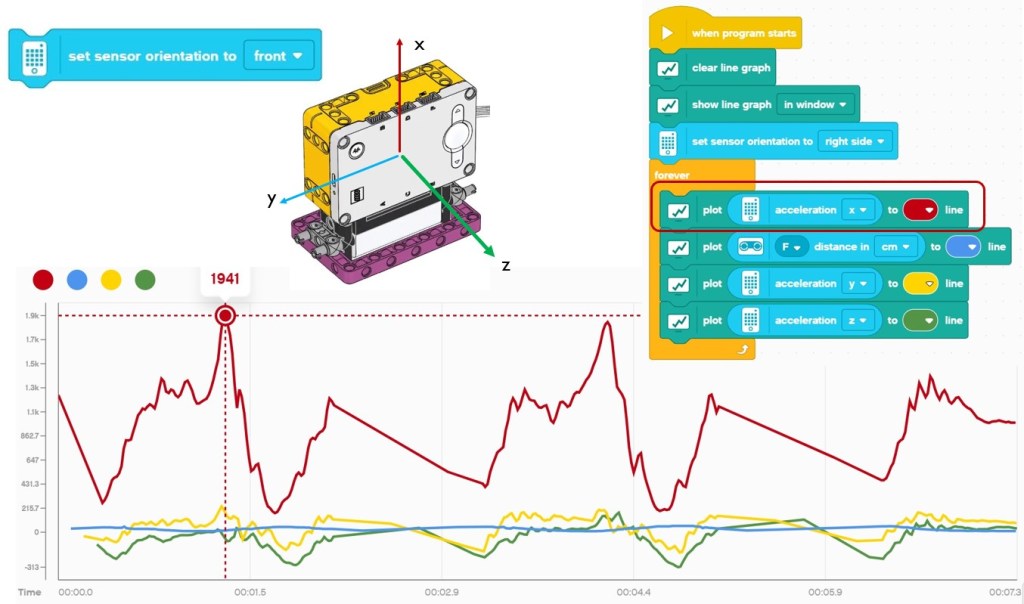
If I change sensor orientation to “right side” to make it consistent with the smart hub’s posture, the axis directions are updated after the setting. Now the positive direction of z axis is facing upward. When I do the same jumping experiment and plot the x, y and z acceleration data, you could see that it is z acceleration data changing the most.

The Units on the Data
In the previous section of “Understand Accelerometer Raw Data”, I mentioned that: vertical acceleration raw data = real acceleration of the device + 9.81 m/ s2 . Here if sensor orientation is set to “front”, we will get: x acceleration raw data = real acceleration of the device + 9.81 m/ s2 .
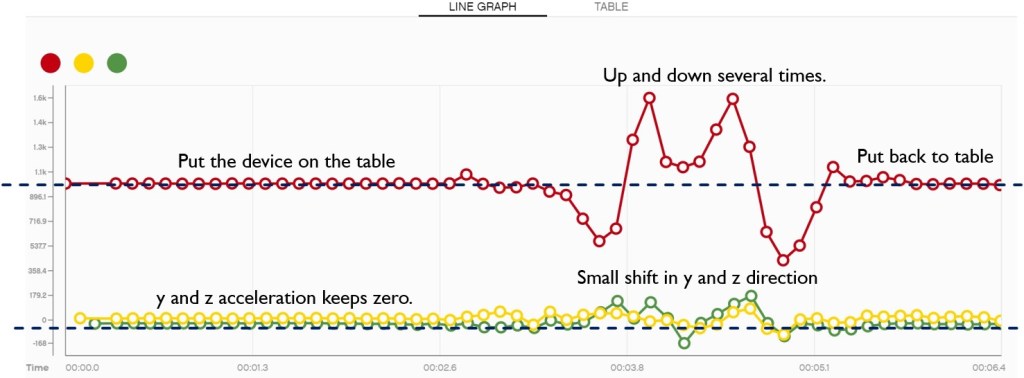
You might have already noticed that in the recorded line graph, when the smart hub is put on the table, the initial value of x acceleration is not 9.81 m/ s2 , but around 1000. This is because the LEGO Spike Prime is using cm/ s2 as acceleration units. As shown in the below graph, the initial acceleration x is around 980 cm/ s2 . When we jump up, the acceleration x increases. When we fall down, the acceleration x decreases to 0 or even lower.
Now you have understood the raw data of accelerometer, the effect of sensor orientation and the units of graph, we could start to explain the code segments one by one.
The Whole Program
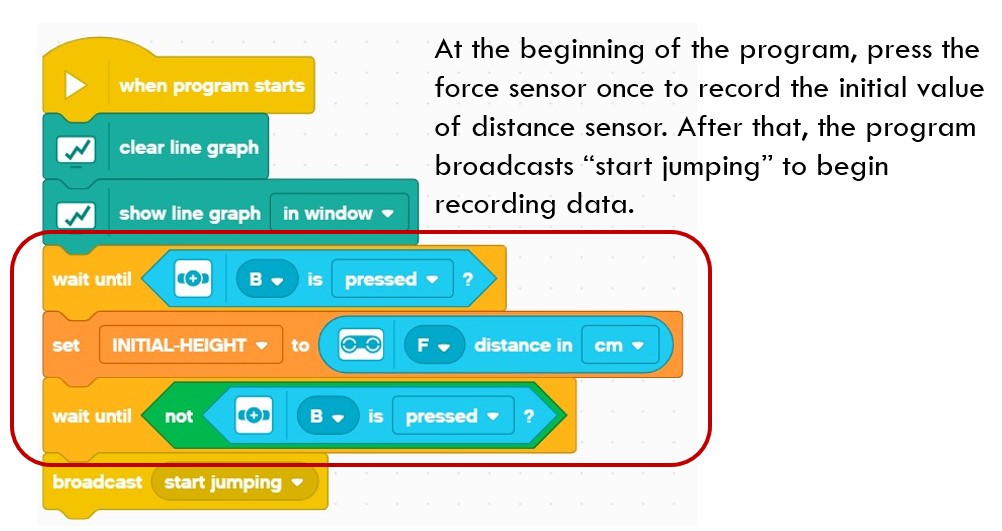
When program starts, it first clears the line graph and shows line graph in window. There are two options for “show line graph” block. If we choose “show line graph in window”, the line graph will display in a small window until we click the “Full Screen” icon to maximize it. If we choose “show line graph in fullscreen”, the data will show in a maximized window after program stops. I would say either option is OK. It is all up to your own habit.
After setting line graph style, the program will wait for user to press the force sensor. Its purpose is to get the initial value of distance sensor, which is a value read by distance sensor when user stands up and gets ready for jumping.
Once getting the initial value of distance sensor, the program broadcasts “start jumping” message.
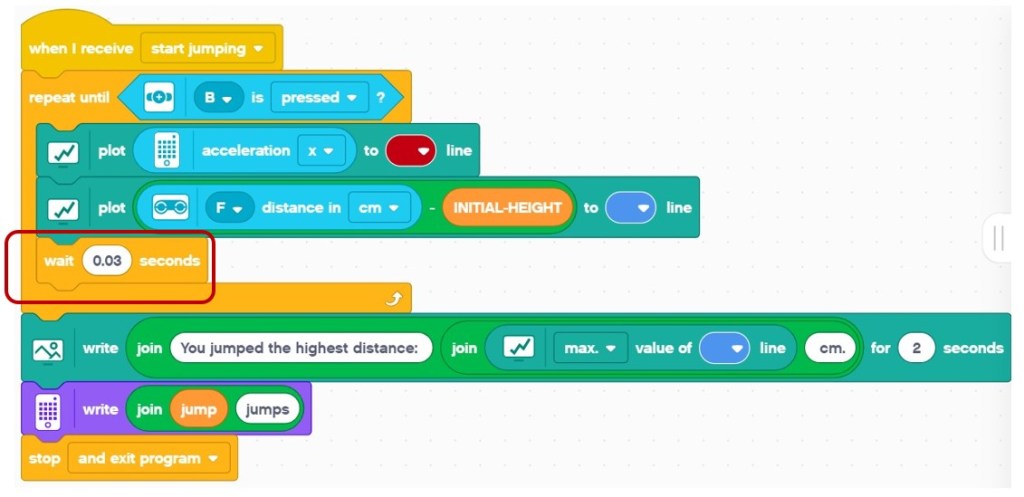
In code segment of “when I receive start jumping”, it begins collecting accelerometer’s data and the value change of distance sensor. In the previous section, we know that “acceleration x” represents the acceleration on vertical direction. We do not care the value change in the horizontal plates, so we only need to collect value of “acceleration x”, and ignore “acceleration y” and “acceleration z”.
This data collection process continues until the user presses force sensor again. The recorded maximum value change of distance sensor is the biggest height the user jumps.

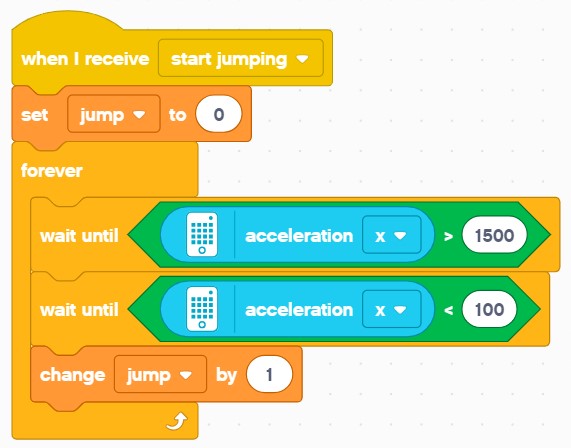
In a parallel code segment of “start jumping”, the program catches the data where “acceleration x” increases above 1500, which means to start jump. It then waits for the data falling below 100, which means to finish jump. The program increases “jump” variable by 1.
The Line Graph and Issues
This is the recorded data from accelerometer. We noticed that some data is missing every after a cluster of data is collected. Those data missing part is shadowed in gray area in the below diagram. This problem is not caused by accelerometer, but by the plot function itself. I did several experiments and noticed that after plotting around 400 data, the plot function needs to “reset” and within this period of around 1 second, it stops plotting any data.
A workaround to this issue is just to record the data directly into a file, instead of using plot block. However, LEGO Spike Prime does not support writing data to file. Therefore, we have to seek other methods. A simplest way is to add “wait” block to extend the interval between data, because it is not necessary to plot data in such an intense time frame (the plot function could collect data as fast as every 0.004 seconds).
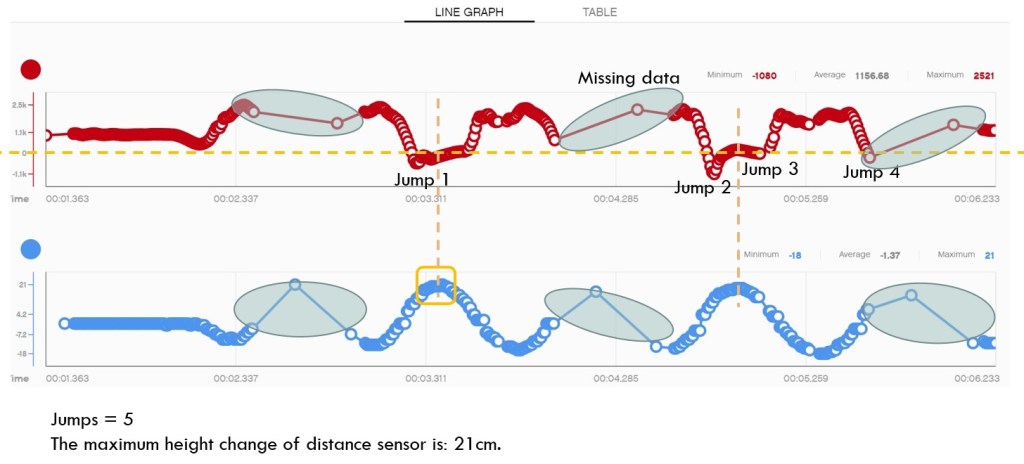
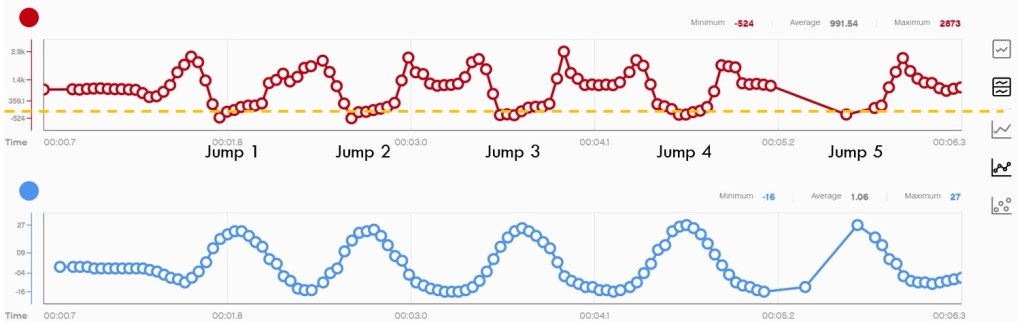
After this adjustment, we could record data and check the line graph again. This time, the data is not so dense. The data missing still exists (around the jump 5) but at least the data of several jumps (jump 1 to jump 4) are complete.
That is all for the data of accelerometer. I hope the above explanation could help you better understand how to use accelerometer functionality of LEGO Spike Prime. Finally, do not forget to enjoy coding and have fun!
Note: All the analysis articles are copyright products of http://www.thecodingfun.com. Anyone re-posting them should credit author and original source. Anyone using them for commercial purposes or translating them into other languages should notify TheCodingFun and get confirmation first. All Rights Reserved.
